Advanced Usage
The Jupyter environment
As mentioned in _usage_basic_background, the python code used for the user interface runs inside a Jupyter environment.
This works in the following manner:
A Jupyter Server is started in the
/src/dashboard/folder, under the root installation directory for the project.This folder contains the following files:
webapp.ipynb(a IPython notebook file)app.py- a regular python file, that acts as the__main__.pyfile for the dashboard app/src/dashboard/webappfolder - this contains the python modules defining the interactive UI widgets used by the dashboard app, as well as additional utility modules.
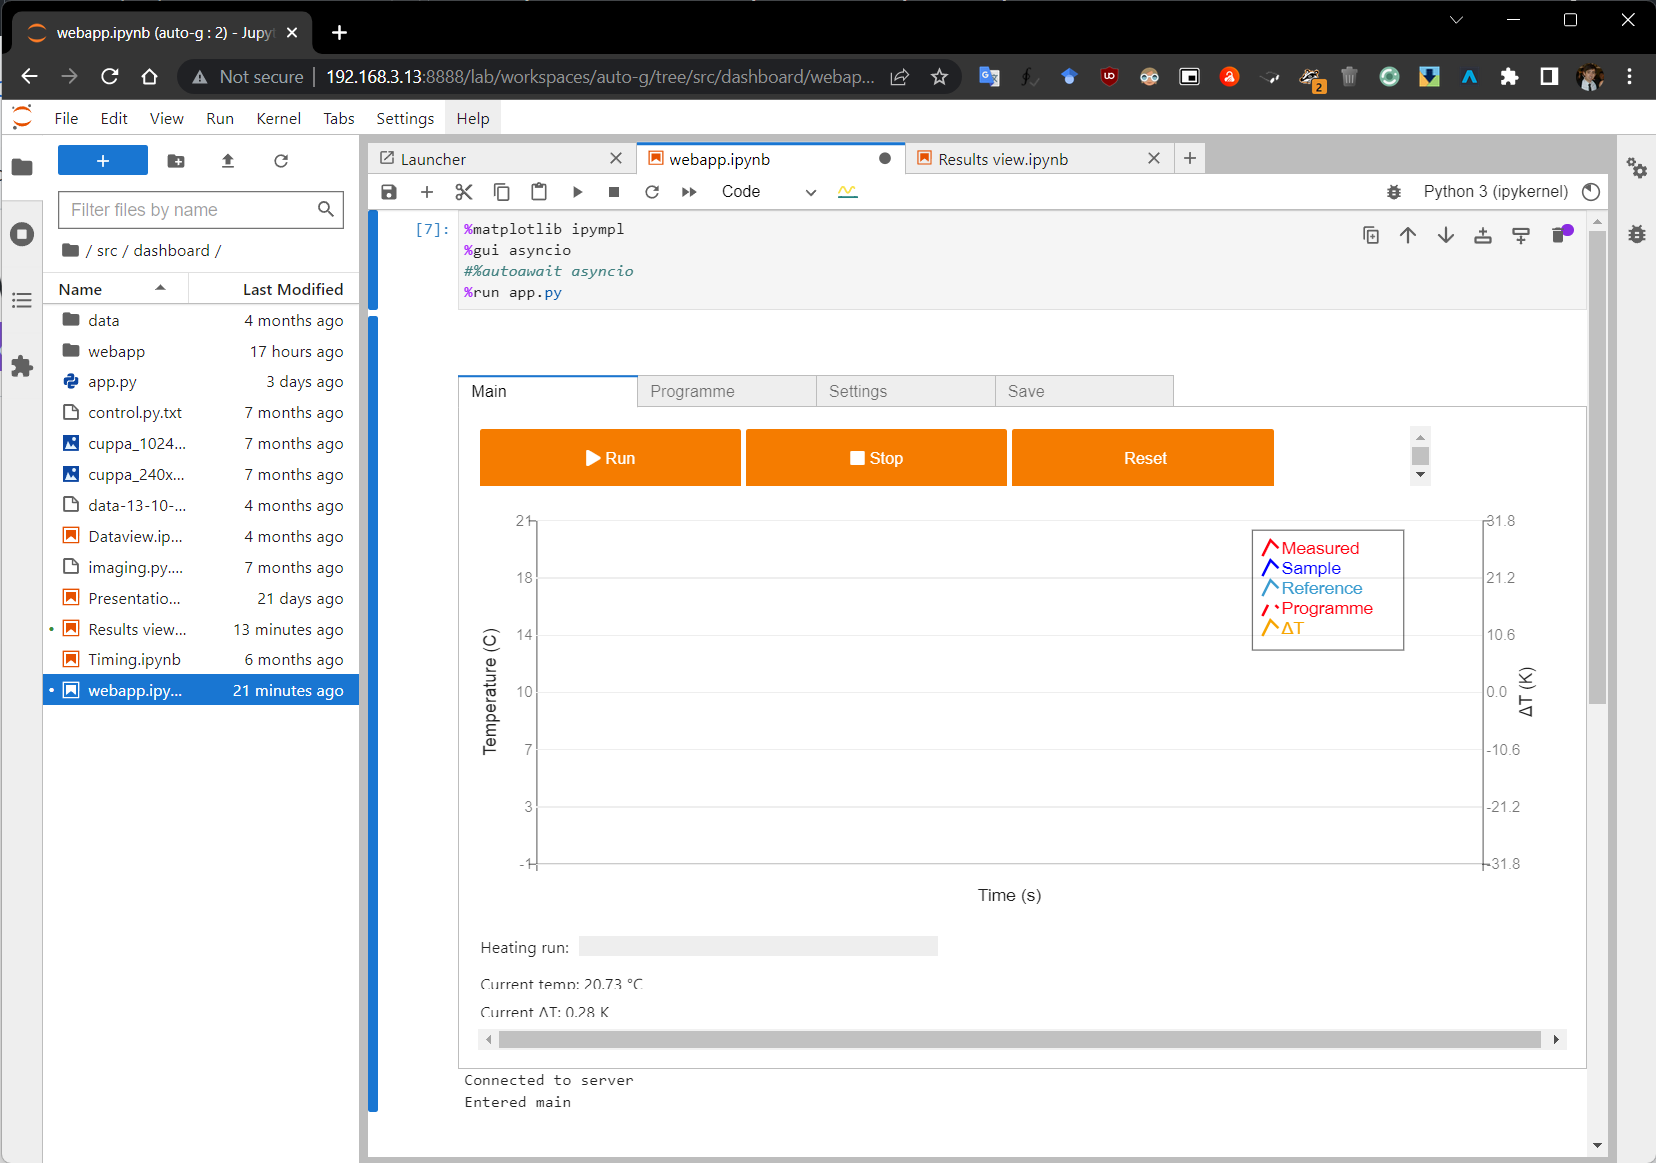
The Jupyter Server automatically starts up a Jupyter environment (see picture below), which is accessible as a webpage on the Raspberry Pi’s local network. This environment allows users to open
*.ipynbfiles and execute python code contained within the notebook’s cells, within a python kernel.webapp.iypnbfeatures a single cell, containing the IPython notebook magic command%run app.py. This instructs Jupyter to run all the code in the fileapp.pywhen the cell is executed.The python code in
app.pysets up the dashboard application, which is composed of UI widgets such as buttons, graphs, tabs, sliders etc. which is then rendered underneath the cell.
Clearly, rendering the dashboard app as a notebook cell’s output results in a sub-optimal user interface, due to the space taken by the Jupyter environment itself.
To get around this, a Jupyter Server extension called voila is used to render the app as a standalone web application, resulting in the final UI shown on the touchscreen.
Using the Jupyter environment
As mentioned above, the dashboard-style web application is intended to provide a streamlined user interface which approximates those found on existing commercial DTA/DSC instruments, with the idea that it should be similarly easy to use in the lab.
However, for those interested in getting more direct access to data, or system behaviour, the Jupyter environment provides an excellent means to do so, owing to the live, interactive nature of Jupyter notebooks.
With direct access to the Python kernel which the application runs in, users can directly interact with data structures relating to sensor measurements or the application’s state itself. And because this is all within a regular Python kernel, any external libraries that users wish to make use of can be imported, such as NumPy/SciPy, Matplotlib, Pandas etc. with the benefit of rich, graphical output, right within the notebook itself.
This facilitates rapid development of new features, allowing users to type in python code and see the effect immediately.
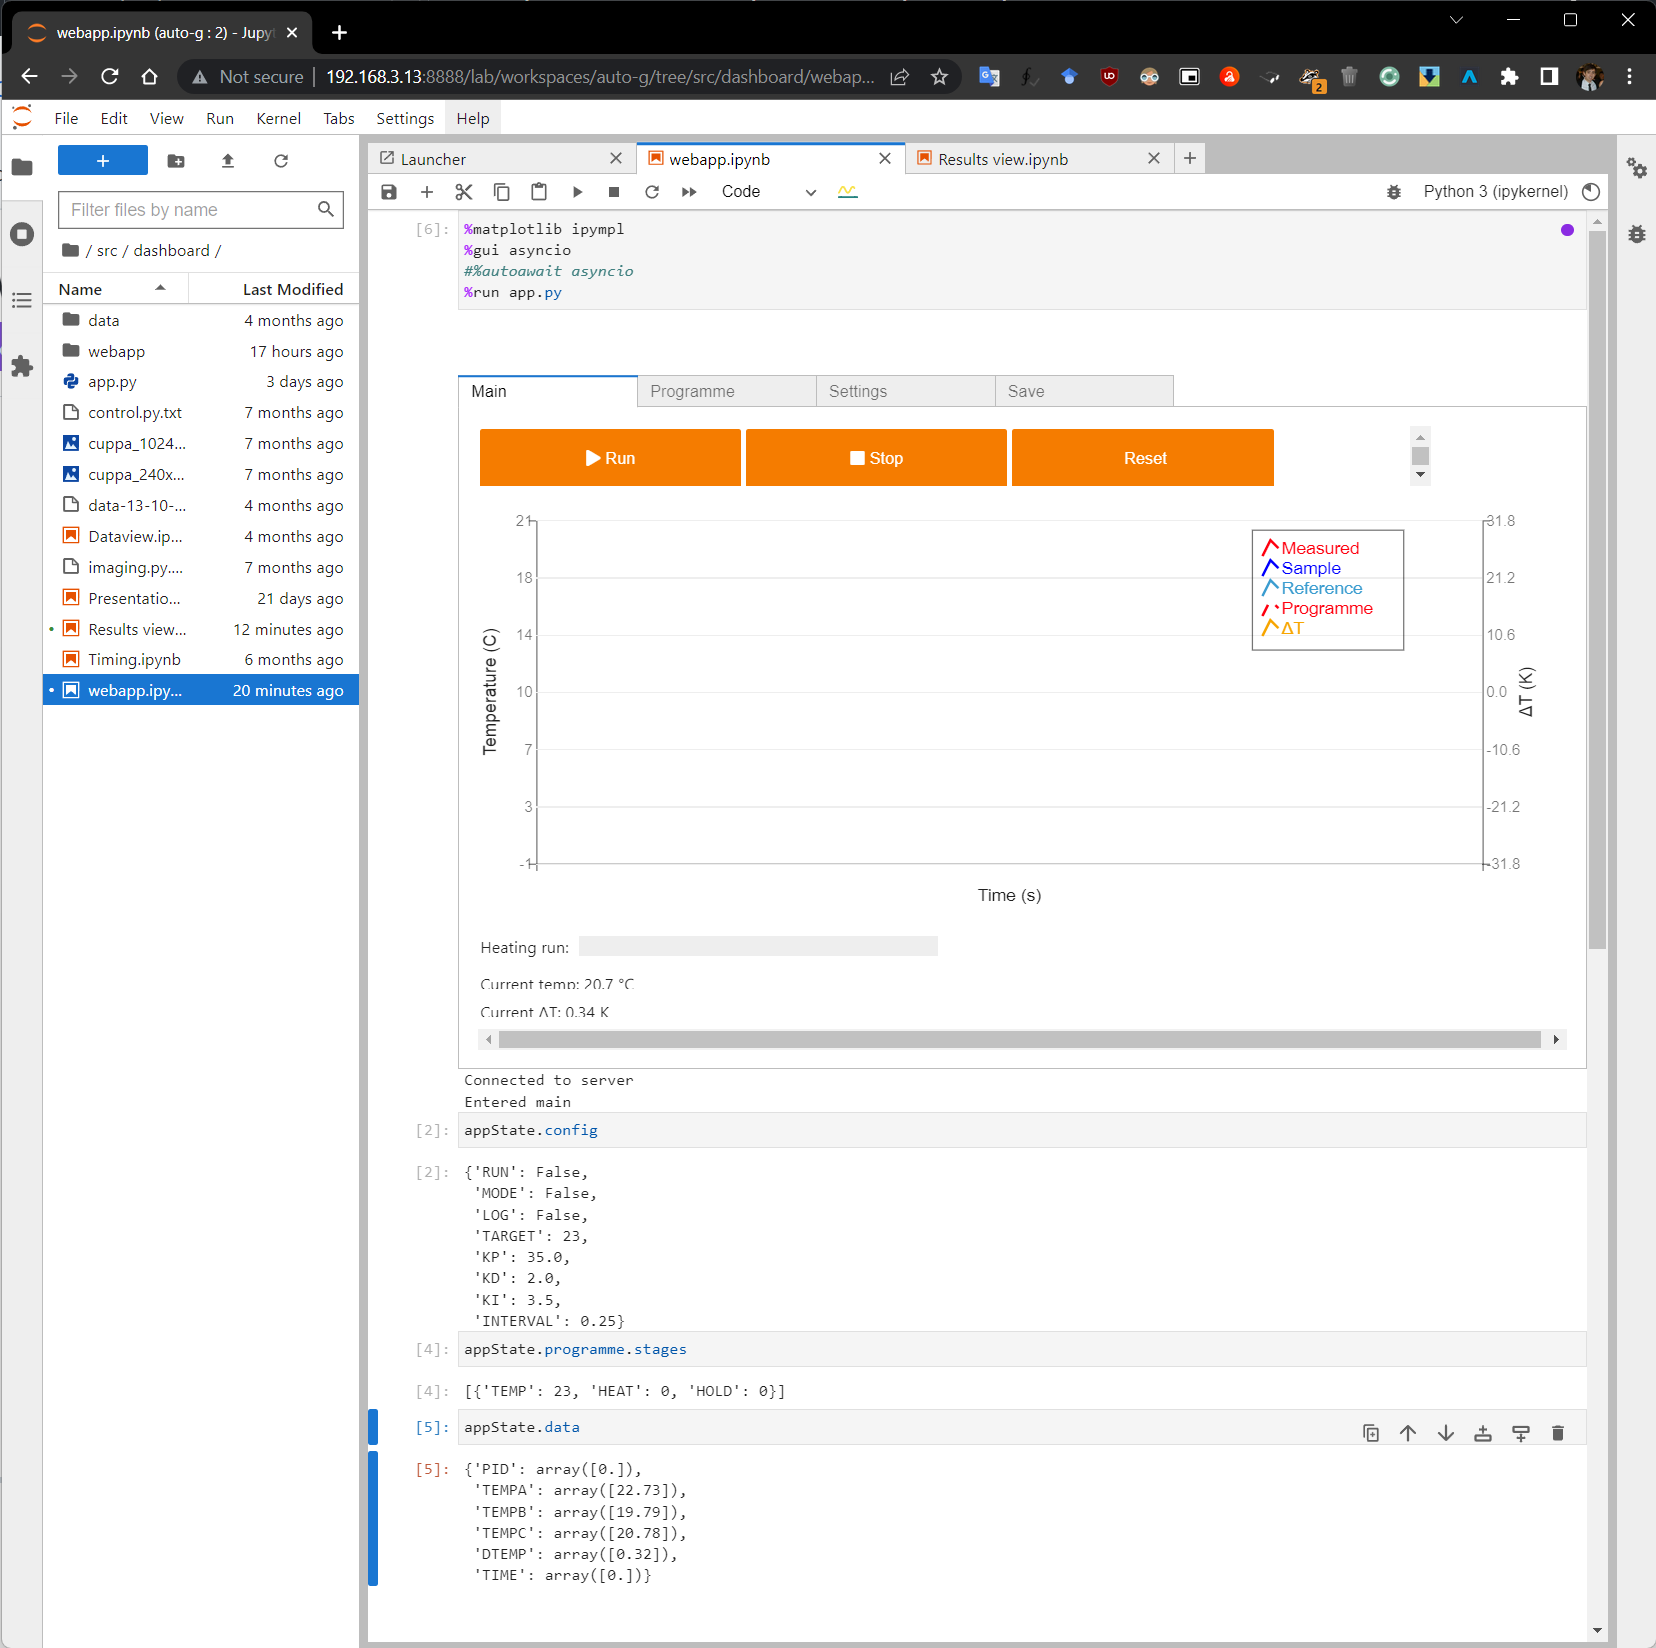
Inspecting system state and data with simple Python commands
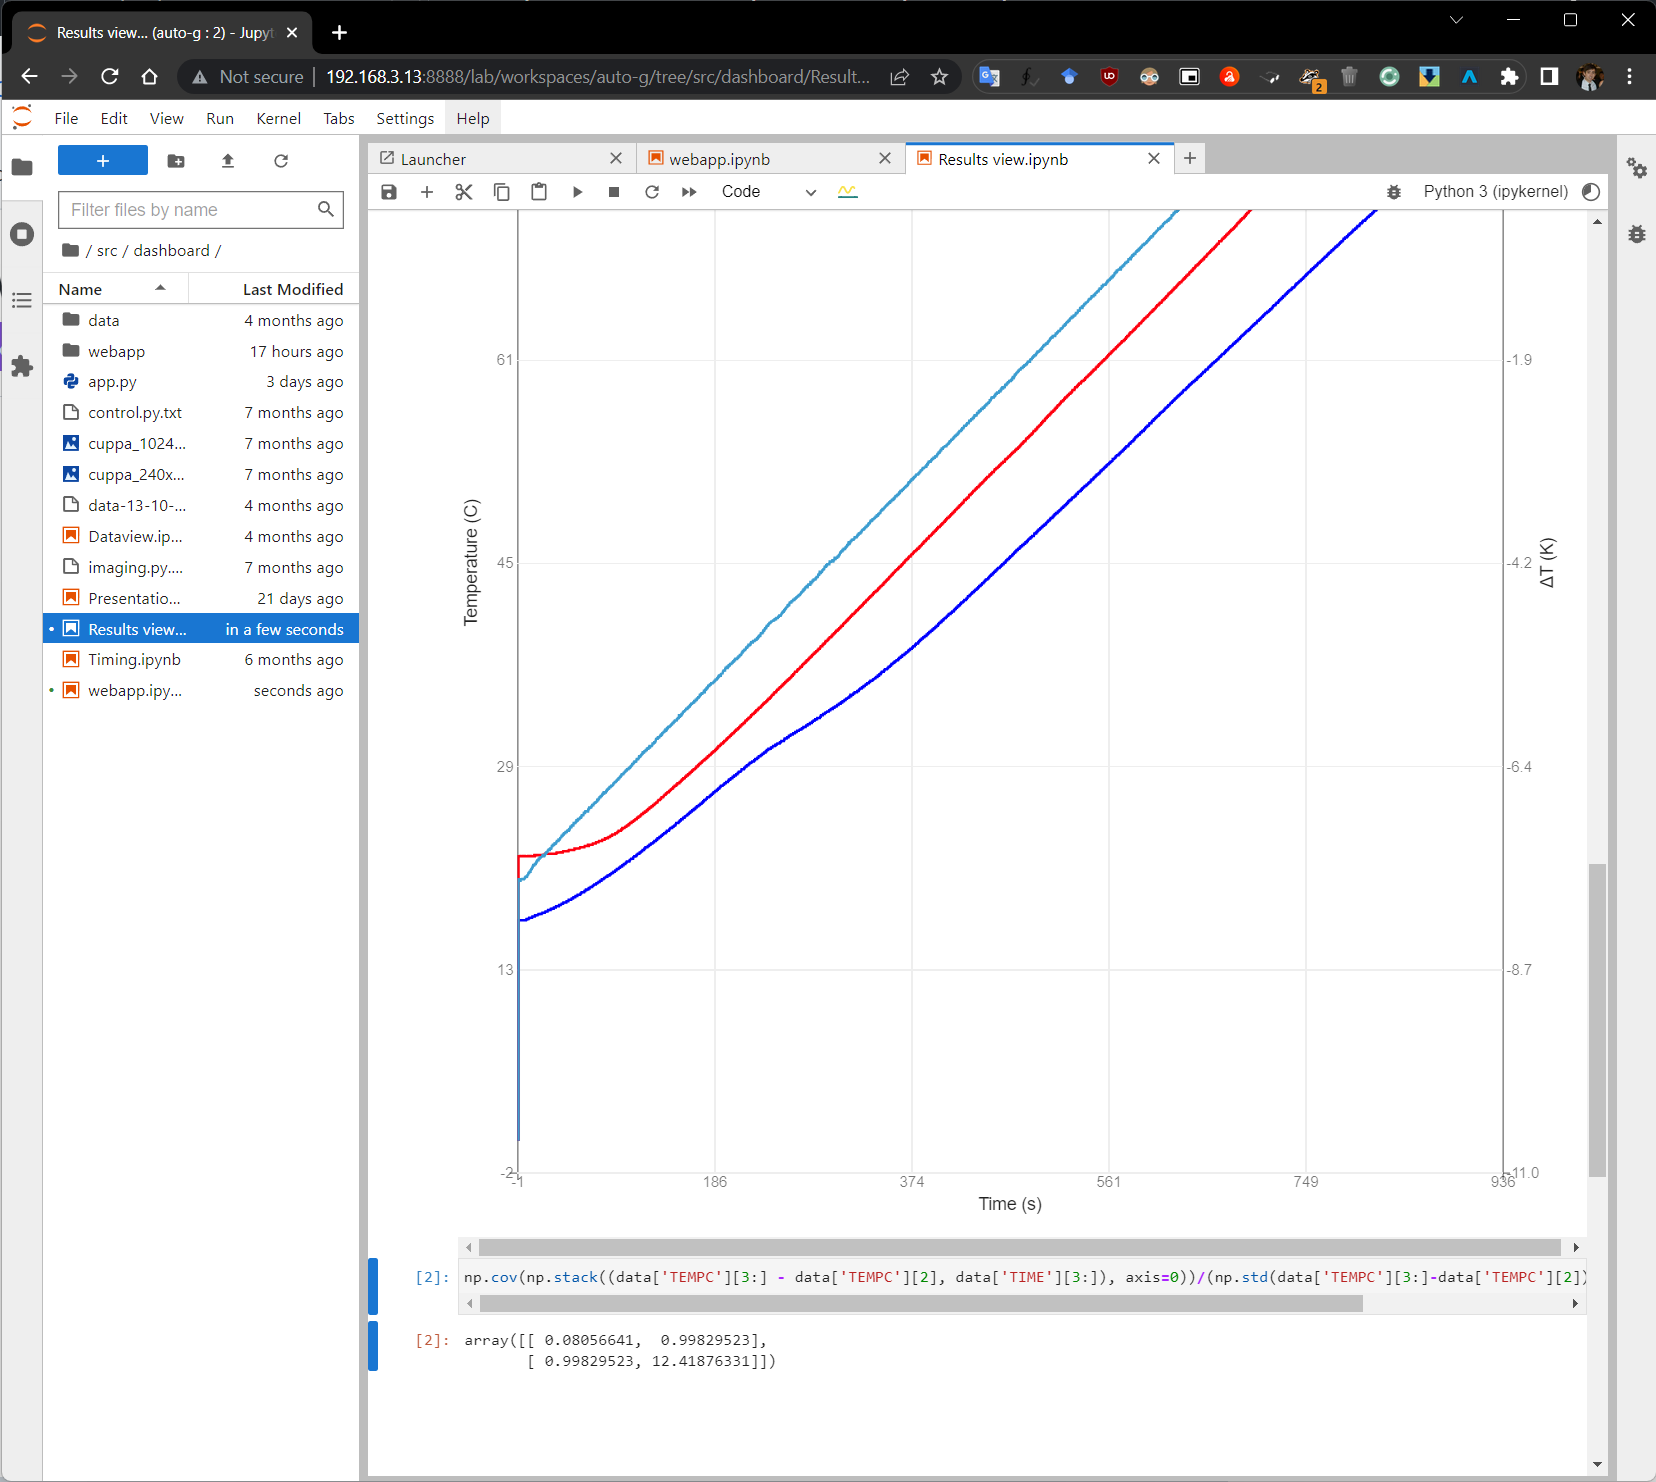
Calculating covariance matrix of temperature against time, using the Numpy library.